Grafana
Das GUI von Grafana 3 war ein Fork von Kibana. Grafana 5 war noch eine AngularJS-basierte Applikation, mit einigen React.js-Komponenten. Plugins waren Angular-Controller, die in data/plugins/your-module/dist/module.js abgelegt und von SystemJS geladen wurden. Die Migration von AngularJS hin zu React wurde gegen Ende 2018 gestartet, und mit Grafana 7 ein grosser Meilenstein erreicht. Damit änderte sich allerdings auch die Plugin-Entwicklung. Seit Grafana 10 ist Angular per default abgeschaltet.
- Links
Installation
Installation:
cat > /etc/yum.repos.d/grafana.repo << EOF
[grafana]
name=grafana
baseurl=https://rpm.grafana.com
repo_gpgcheck=1
enabled=1
gpgcheck=1
gpgkey=https://rpm.grafana.com/gpg.key
sslverify=1
sslcacert=/etc/pki/tls/certs/ca-bundle.crt
EOF
sudo dnf -y install grafana
# The public facing domain name used to access grafana from a browser
# set this, otherwise some redirects might not work (for example OAuth)
domain = 192.0.2.26

# default admin user, created on startup
admin_user = grafana-admin

# default admin password, can be changed before first start of grafana,  or in profile settings
admin_password = linuxfabrik
Wird Grafana ohne separate Datenbank wie MariaDB oder PostgreSQL konfiguriert, nutzt es seine integrierte SQLite-Datenbank.
systemctl enable --now grafana-server
Port 3000/tcp freigeben.
http://grafana:3000/login, Standard-Login ist „admin / admin“.
Logging:
tail -f /var/log/grafana/grafana.log
Grid
Das Standard-Grid besteht aus 24 Spalten (X). Die Anzahl der Zeilen (Y) ist abhängig von der Grösse des Browser-Windows und dessen Auflösung.Die Grid-Positionen beginnen links oben bei 0/0 (Null) an zu zählen.
Grizzly/YML:
Ohne Positionsangaben werden Panels links oben positioniert, und weitere endlos nach unten forlaufend angehängt.
Panels
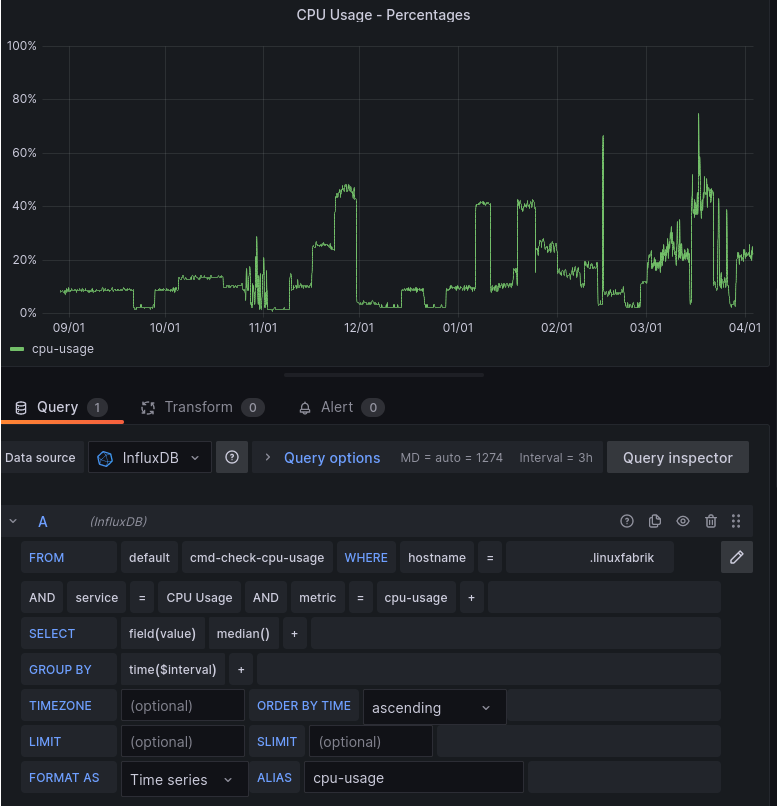
Um die Anzahl der Datenpunkte in Panels zu reduzieren (wichtig bei grossen Zeiträumen), empfiehlt sich
ein
GROUP BY time($interval), ...in den Queries.mit Aggregatsfunktionen wie
mean()unddistinct(), oder mit Selektor-Funktionen wiefirst()zu arbeiten.
Aggregatsfunktionen erklärt:
Eine effiziente SQL-Query wäre:
SELECT mean("value")
FROM "my-table"
WHERE ("col1" = 'val1' AND "col2" = 'val2') AND $timeFilter
GROUP BY time($interval)
Im GUI:
Kiosk-Mode
Um Grafana-Dashboards ohne störende Menüs im Kiosk-Mode laufen zu lassen, die Dashboard-URL um den Parameter &kiosk ergänzen.
Keycloak (OAuth)
- Grafana-Seite
Grafana lässt sich an Keycloak (für Grafana ein OAuth-IdP) anbinden. Die Grafana-Seite muss wie folgt konfiguriert werden:
/etc/grafana/grafana.ini[auth.generic_oauth] enabled = true name = Keycloak IdP allow_sign_up = true client_id = grafana client_secret = e8d78053-fd47-4ec3-b6dc-87357f18f8d5 scopes = openid email profile ;email_attribute_name = email:primary ;email_attribute_path = ;login_attribute_path = ;id_token_attribute_name = auth_url = http://keycloak:8080/auth/realms/grafana/protocol/openid-connect/auth token_url = http://keycloak:8080/auth/realms/grafana/protocol/openid-connect/token api_url = http://keycloak:8080/auth/realms/grafana/protocol/openid-connect/userinfo ;allowed_domains = ;team_ids = ;allowed_organizations = role_attribute_path = "contains(roles[*], 'admin') && 'Admin' || contains(roles[*], 'editor') && 'Editor' || 'Viewer'" ;tls_skip_verify_insecure = false ;tls_client_cert = ;tls_client_key = ;tls_client_ca =
allow_sign_up = trueist notwendig, da ansonsten Grafana den von Keycloak übermittelten Benutzer nicht in seiner eigenen Datenbank anlegen kann (man erhält die FehlermeldungNot allowing oauth_generic_oauth login, user not found in internal user database and allow signup = false).Wer mag, einen Admin-User im Keycloak angelegt hat und Keycloak vertraut, kann das klassische Anmelde-Formular per
disable_login_form = falseabschalten, so dass nur noch eine Anmeldung per Keycloak möglich ist- Keycloak-Seite
Besonderheiten eines Realms für Grafana: der OAuth-Client in Grafana versteht Roles - Keycloak teilt Grafana also die gewünschte Berechtigungsstufe mit. Im Beispiel wird eine
admin-Rolle angelegt, der ein Keycloak-User zugewiesen wird.Neuer Client „Grafana“ mit „openid-connect“.
Clients > „grafana“ > Settings
Client ID: grafana
Name: Grafana (wird im Self-Service-Portal unter „Applications“ verwendet)
Description: Any descriptive text (wird im Self-Service-Portal unter „Applications“ verwendet)
Client Protocol: openid-connect
Access Type: confidential
Valid Redirect URIs: http://grafana:3000/login/generic_oauth
Base URL: http://grafana:3000/login/generic_oauth (wird im Self-Service-Portal unter „Applications“ verwendet)
Clients > „grafana“ > Roles > Add
admin
editor
viewer
Benutzer anlegen und Rolle zuweisen:
Users > User suchen, Edit > Role Mappings > Client Roles > „grafana“ > Assign „admin“ role (oder „editor“, oder „viewer“)
Wir möchten im Client-Token nur das mitteilen, was wir explizit definieren:
Clients > „grafana“ > Scope > Full Scope Allowed: OFF
Grafana muss anschliessend in der Lage sein, die Berechtigungsstufe aus dem JWT-Token zu extrahieren. Dazu muss in Keycloak ein „Client Mapper“ definiert werden:
Clients > „grafana“ > Mappers > Create
Name: Keycloak Role to Client Role
Mapper Type: User Client Role
Client ID: grafana
Token Claim Name: roles
Claim JSON type: string
Add to ID token: ON
Add to access token: OFF
Add to userinfo: OFF
Der Benutzer wird bei der Anmeldung in Grafana an Keycloak umgeleitet. Ist der Benutzer authentifiziert, wird er in Grafana mit der ihm in Keycloak zugeordneten Rolle angelegt. Wird die Rolle des Benutzers nachträglich in Keycloak geändert, erhält der Benutzer seine neue Gruppenzugehörigkeit beim nächsten Login in Grafana.
Das Grafana-API
Im Beispiel: Export aller Datasources aus Grafana per API (ist auch nicht anders möglich).
Zunächst im Grafana unter Configuration > API Keys einen neuen API-Key erstellen. Den Bearer-TOken unbedingt notieren. Anschliessend lassen sich API-Calls durchführen, beispielsweise:
# Content of Dashboards > Home
curl -H "Authorization: Bearer eyJrIjoiTTZFSjVDdVo1ZTNtOUZkN1Myc3pva3hGcjZCakxhOHIiLCJuIjoiY3VybGVyIiwiaWQiOjF9" http://192.0.2.74:3000/api/dashboards/home | jq

# Export all Datasources (API-Key needs Admin Permissions)
curl -H "Authorization: Bearer eyJrIjoiTTZFSjVDdVo1ZTNtOUZkN1Myc3pva3hGcjZCakxhOHIiLCJuIjoiY3VybGVyIiwiaWQiOjF9" http://192.0.2.74:3000/api/datasources | jq
Das API ist hier beschrieben: https://grafana.com/docs/grafana/latest/http_api/
Plugins
Plugins müssen für bestimmte Grafana-Versionen signiert sein, damit sie dort geladen werden können. Ausnahmen lassen sich so definieren:
[plugins]
# Enter a comma-separated list of plugin identifiers to identify plugins that are allowed
# to be loaded even if they lack a valid signature.
allow_loading_unsigned_plugins = simpod-json-datasource
Ab Grafana 7.0 wird die Entwicklung Angular-basierter Plugins nicht mehr empfohlen (gelten jetzt als „Legacy Plugins“), daher React verwenden.
Techniken:
Bis Version 6: Angular, node & npm/yarn, Build-Prozess basiert auf grunt
Ab Version 7: React/JSX, node & yarn
Plugin Typen:
Panel: Custom visualization for your dashboards
Data Source: plugin to add support for your own data sources
Backend Data Source: lets your data source plugin communicate with a process running on the server instead in the Browser
Grizzly
Mit Grizzly lassen sich Grafana-Elemente wie Datasources oder Dashboards in YAML definieren und „as Code“ pflegen. Grizzly nutzt dabei das Grafana REST-API.
Installation von Grizzly (zum Beispiel auf der lokalen Admin-Workstation):
VER=0.3.1
sudo curl --fail --show-error --location --output "/usr/local/bin/grr" "https://github.com/grafana/grizzly/releases/download/v$VER/grr-linux-amd64"
sudo chmod a+x "/usr/local/bin/grr"

grr --help
In Grafana Authentication auf Basis eines „Service Accounts“ konfigurieren:
Grafana > Administration > Service Accounts > Add Service Account: Name = grizzly, Role = Editor, Add service account token
Hinweis: Wer Datasources deployen möchte, benötigt Admin-Rechte.
Auf der Maschine mit Grizzly passende Environment-Variablen setzen:
export GRAFANA_URL=http://192.0.2.74:3000
export GRAFANA_USER=grizzly
export GRAFANA_TOKEN=mytoken
Eine Dashboard-Definition im Beispiel:
apiVersion: grizzly.grafana.com/v1alpha1
kind: Dashboard
metadata:
  folder: general
  name: uuid-of-dashboard
spec:
  schemaVersion: 2022122205
  tags:
    - templated with Grizzly
  time:
    from: now-6h
    to: now
  timepicker:
    hidden: false
    refresh_intervals:
      - 20s
      - 30s
      - 45s
  timezone: browser
  title: My Title
  uid: uuid-of-dashboard
  description: My Description
  editable: true
  liveNow: true
  refresh: 45s

  panels:

    # text panel
    - gridPos:
        x: 4
        "y": 0
        h: 3
        w: 2
      options:
        content: '<p style="text-align: center; font-size: 2em;">My Text</p>'
        mode: html
      type: text

    # json datasource panel
    - gridPos:
        x: 4
        "y": 6
        h: 3
        w: 1
      datasource:
        type: simpod-json-datasource
        uid: uuid-of-datasource
      fieldConfig:
        defaults:
          color:
            mode: thresholds
          noValue: "0"
          thresholds:
            steps:
              - color: green
                value: null
              - color: red
                value: 1
          unit: none
      options:
        colorMode: background
        reduceOptions:
          calcs:
            - count
          fields: /^attrs_name$/
          values: false
      targets:
        - data: |+
            {
              "myapp_api_endpoint": "/v1/objects/hosts",
              "myapp_request_data": {
                "attrs": [ "name", "address" ],
                "filter": "host.state != 0.0 && host.downtime_depth == 0.0 && host.acknowledgement == 0.0"
              }
            }
          refId: A
          target: myapp
          type: table
      title: " "
      type: stat
Beispiel-Definition einer Datasource:
apiVersion: grizzly.grafana.com/v1alpha1
kind: Datasource
metadata:
    name: uuid-of-datasource
spec:
    access: proxy
    basicAuth: false
    basicAuthUser: ""
    database: ""
    isDefault: false
    jsonData:
        httpHeaderName1: myapp-user
        httpHeaderName2: myapp-password
        httpHeaderName3: myapp-url
    name: uuid-of-datasource
    orgId: 4711
    readOnly: false
    secureJsonFields:
        httpHeaderValue1: true
        httpHeaderValue2: true
        httpHeaderValue3: true
    type: simpod-json-datasource
    typeLogoUrl: ""
    uid: uuid-of-datasource
    url: http://myhost:port/api/
    user: ""
    withCredentials: false
Gibt es Unterschiede zum bestehenden Dashboard?
grr diff dashboard.yml
Datasource und Dashboard uploaden:
grr apply datasource.yml
grr apply dashboard.yml
Definitionen downloaden, um eine Vorlage für weitere Anpassungen zu erhalten:
grr get Datasource.my-uid
grr get Dashboard.my-uid
Tipp
Um die Original JSON-Definitionen aus Grafana in YAML umzuwandeln, die JSON-Definition in eine input.json packen und diesen Python One-Liner verwenden:
python -c 'import sys, yaml, json; print(yaml.dump(json.loads(sys.stdin.read())))' < input.json
Troubleshooting
- level=error msg=“provisioned dashboard cannot be deleted“
Dashboard liegt in
/etc/grafana/provisioning/dashboards. Lässt sich über das GUI nicht entfernen, und muss aus dem Ordner entfernt werden.- Error: Failed to download metadata for repo ‚grafana‘: repomd.xml GPG signature verification error: Bad GPG signature
Falls es an https://grafana.com/blog/2023/01/12/grafana-labs-update-regarding-circleci-security-updates/ liegt:
dnf clean all
rm -rf /var/cache/dnf/*
GRAFANA_KEY=$(rpm --query gpg-pubkey --queryformat '%{name}-%{version}-%{release} --> %{summary}\n' | grep -i grafana | cut -f1 -d" ")
rpm --erase $GRAFANA_KEY
dnf repolist
- Grizzly:
FATA[0000] [POST /dashboards/db][403] postDashboardForbidden &{Error: Message:0xc000279ea0 Status:} Tritt bei uns mit Version 0.3 und
grr apply dashboard.ymlauf. Mit Version 0.2 funktioniert es.
Built on 2024-04-18