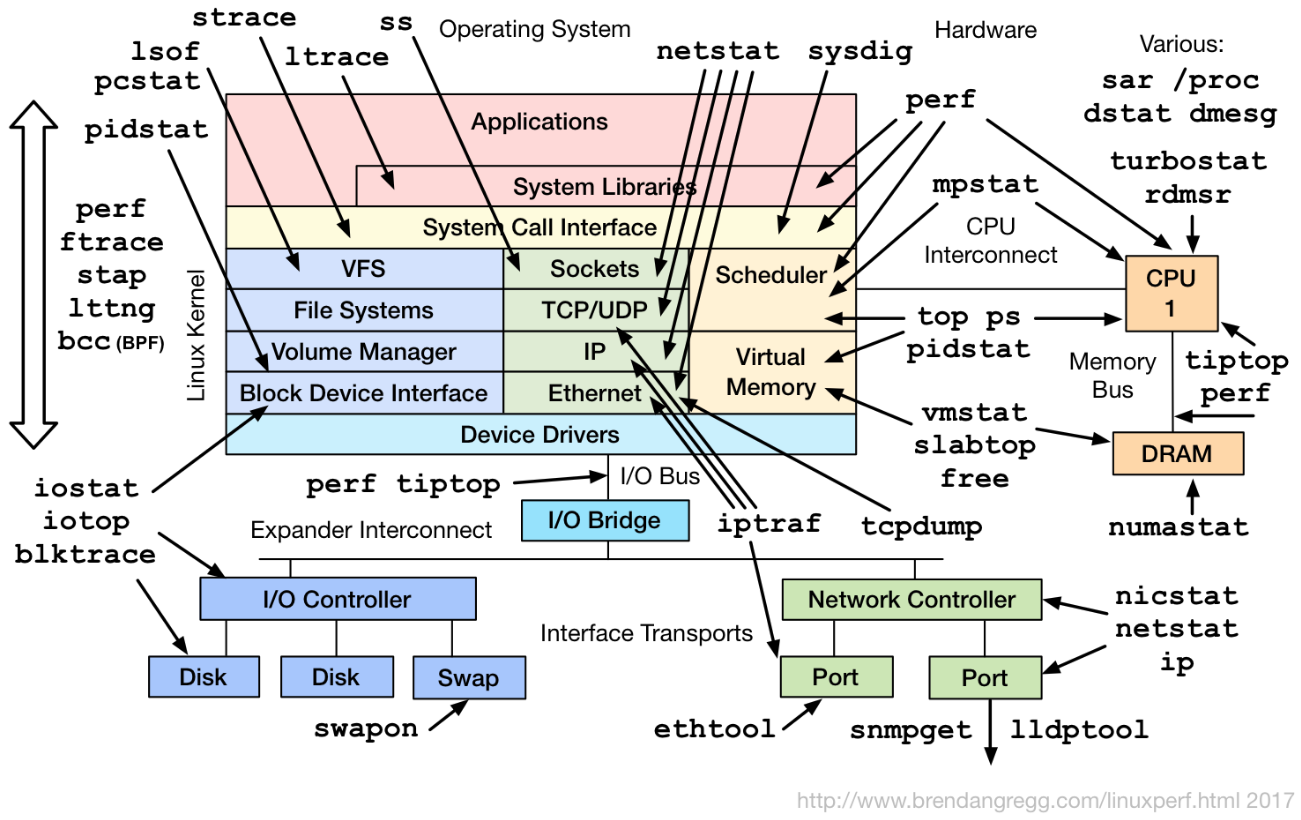
Benchmarks
Eine Auswahl an kleineren und spezialisierten Statistik- und Benchmark-Tools in der Übersicht.

Datenbanken:
CPU Performance Comparison: https://www.cpubenchmark.net/singleCompare.php
Prozessor
Simpler 1-Core-Test
Pi auf 5’000 Stellen berechnen:
dnf -y install bc
bash -c 'time echo "scale=5000; a(1)*4" | bc -l | grep real'
Ergebnisse (dreimal laufen gelassen, das beste Ergebnis aus „real“ wird verwendet; CPU-Bezeichnung aus lscpu):
12.599s - Intel(R) Core(TM) i7-8700 CPU @ 3.20GHz
14.000s - Intel(R) Core(TM) i7-1065G7 CPU @ 1.30GHz
14.244s - Intel(R) Xeon(R) CPU E5-1650 v4 @ 3.60GHz
15.065s - Intel(R) Core(TM) i7-7600U CPU @ 2.80GHz
17.456s - Intel(R) Xeon(R) CPU E5-2660 v3 @ 2.60GHz
18.487s - Intel(R) Core(TM) i7-4600U CPU @ 2.10GHz
19.838s - Intel(R) Core(TM) i7-6500U CPU @ 2.50GHz
21.106s - Intel(R) Xeon(R) CPU E5-2699 v3 @ 2.30GHz
23.647s - Intel(R) Xeon(R) CPU E5-2650 0 @ 2.00GHz
24.114s - Intel(R) Xeon(R) CPU X5670 @ 2.93GHz
24.233s - Intel(R) Xeon(R) CPU X5670 @ 2.93GHz
24.651s - Intel(R) Xeon(R) CPU E5-2697 v4 @ 2.30GHz
25.940s - Intel(R) Xeon(R) CPU X5670 @ 2.93GHz
27.906s - Intel(R) Xeon(R) CPU E5-2650 @ 2.00GHz
28.870s - Intel(R) Xeon(R) CPU E5440 @ 2.83GHz
29.296s - Intel Core 2 Duo P9xxx (Penryn Class Core 2) @ 2.83 GHz
112.100s - Intel(R) Atom(TM) CPU D510 @ 1.66GHz
Disks / Festplatten
fio
fio ist der „Flexible IO Tester“ von Jens Axboe. fio ist für Linux, Windows, macOS, BSD und andere verfügbar und kann gegen Block-Devices oder ein Verzeichnis/eine Datei laufen.
dnf -y install fio
cd /path/to/disk/mount
Folgende Tests sind https://arstechnica.com/gadgets/2020/02/how-fast-are-your-disks-find-out-the-open-source-way-with-fio/ entnommen.
- Single 4KiB random write process
Simulating copying home directories and dotfiles, manipulating email stuff, some database operations, source code trees
fio --name=random-write --ioengine=libaio --rw=randwrite --bs=4k --size=4g --numjobs=1 --iodepth=1 --runtime=60 --time_based --end_fsync=1; rm -f random-write.0.0

# SATA-SSD: 127MiB/sec
# 7200er-HDD: 33MiB/sec
- 16 parallel 64KiB random write processes
Simulating a busy system like a NAS, which needs to handle multiple 1MB operations simultaneously
fio --name=random-write --ioengine=libaio --rw=randwrite --bs=64k --size=256m --numjobs=16 --iodepth=16 --runtime=60 --time_based --end_fsync=1
- Single 1MiB random write process
Simulating a real-world system doing real-world things.
fio --name=random-write --ioengine=libaio --rw=randwrite --bs=1m --size=16g --numjobs=1 --iodepth=1 --runtime=60 --time_based --end_fsync=1
- Continously read performance
fio --name=test --filename=test --size=100M --readwrite=read; rm -f test
- Random read/write performance
This will create a 100 MB file, and perform 4KB reads and writes using a 80%/20% (typical) split within the file, with 64 operations running at a time. The 3:1 ratio is a rough approximation of your typical database.
fio --direct=1 --gtod_reduce=1 --name=test --filename=test --size=100M --readwrite=randrw --rwmixread=80; rm -f test
- Random read performance
fio --ioengine=libaio --direct=1 --gtod_reduce=1 --name=test --filename=test --bs=4k --iodepth=64 --size=4G --readwrite=randread; rm -f test
hdparm
Rohe Device Geschwindigkeit, ohne darunterliegendes Dateisystem zu testen.
dnf -y install hdparm

hdparm -t --direct /dev/sdx
Rotierende Disks sind innen langsamer als aussen. Um z.B. eine 12 TB grosse Disk innen zu lesen, die ersten 10 TB überspringen:
hdparm -t --direct --offset 10240 /dev/sdb
# -t: nur Device testen
# -T: nur Linux Buffers testen
# Ergebnis wechselt von 245 MB/sec auf 134 MB/sec
iostat
dnf -y install sysstat

# Reads/sec and writes/sec separated with a slash:
iostat -dx sda | grep sda | awk '{ print $4"/"$5; }'
Netzwerk
iperf
Nach Möglichkeit sollte iperf3 als Nachfolger von iperf verwendet werden. Für Freunde eines GUIs gibt es ein (uraltes) jperf.
Netzwerkverbindung zwischen zwei Maschinen testen:
# EPEL
dnf -y install iperf3

# on server: open port 5001, limit to 10 Mbit max.
iperf3 --server --bind=myip --bandwidth=10m

# on client (sender), report Mbits, run 2 minutes
iperf3 --bind=myip --format=m --interval 1 --time 120 --client <iperf-server>
Mit iperf lässt sich die Netzwerkbandbreite natürlich auch nach aussen, gegen öffentlich verfügbare iperf-Server mit bis zu 40 Gbps testen. Beispiel:
iperf3 --format=m --interval 5 --time 30 --port=5204 --client ping.online.net
Internet-Anbindung
Speedtest der Internet-Anbindung von der Kommandozeile aus (Speedtest by Ookla):
wget --output-document=speedtest-cli https://raw.githubusercontent.com/sivel/speedtest-cli/master/speedtest.py
python3 speedtest-cli | grep -E '(Upload|Download)'
Ausgehend muss Port 8080 erlaubt sein.
Benchmark-Suites
stress
# EPEL
dnf -y install stress

# CPU
stress --cpu 2 --timeout 60
sysbench
Siehe https://github.com/akopytov/sysbench
# from EPEL repo:
dnf -y install sysbench

# sysbench <test: fileio|cpu|memory|threads|mutex> <command: prepare|run|cleanup|help>
CPU performance test - Interessant: „events per second“:
sysbench cpu run | grep 'events per second'
Memory functions speed test - Interessant: „MiB/sec“:
sysbench memory run | grep 'MiB/sec'
Threads subsystem performance test - Interessant: „total number of events“:
sysbench threads run | grep 'total number of events'
File I/O test - vor den Tests Dateien erstellen lassen, und am Ende aufräumen. „seqrewr“ bedeutet „sequential rewrite“. Interessant: „MiB/sec“:
cd /path/to/your/disk

sysbench fileio prepare 1> /dev/null
sysbench fileio --file-test-mode=seqrd run | grep 'read, MiB/s'
sysbench fileio cleanup 1> /dev/null

sysbench fileio prepare 1> /dev/null
sysbench fileio --file-test-mode=seqwr run | grep 'written, MiB/s'
sysbench fileio cleanup 1> /dev/null

sysbench fileio prepare 1> /dev/null
sysbench fileio --file-test-mode=rndrd run | grep 'read, MiB/s'
sysbench fileio cleanup 1> /dev/null

sysbench fileio prepare 1> /dev/null
sysbench fileio --file-test-mode=rndwr run | grep 'written, MiB/s'
sysbench fileio cleanup 1> /dev/null


# special purpose
sysbench fileio prepare 1> /dev/null
sysbench fileio --file-test-mode=seqrewr run | grep 'written, MiB/s'
sysbench fileio cleanup 1> /dev/null

sysbench fileio prepare 1> /dev/null
sysbench fileio --file-test-mode=rndrw run | grep -E '(read, MiB/s|written, MiB/s)'
sysbench fileio cleanup 1> /dev/null
Mutex performance test:
sysbench mutex run
MySQL / MariaDB:
sysbench oltp \
          --mysql-db=loadtest \
          --mysql-password=loadtest \
          --mysql-socket=/tmp/mysql.sock \
          --mysql-user=loadtest \
          run
Ein Output des CPU-Tests sieht so aus:
sysbench 1.0.20 (using system LuaJIT 2.1.0-beta3)

Running the test with following options:
Number of threads: 1
Initializing random number generator from current time


Prime numbers limit: 10000

Initializing worker threads...

Threads started!

CPU speed:
    events per second:   558.06

General statistics:
    total time:                          10.0011s
    total number of events:              5583

Latency (ms):
         min:                                    1.48
         avg:                                    1.79
         max:                                    3.87
         95th percentile:                        2.03
         sum:                                 9992.67

Threads fairness:
    events (avg/stddev):           5583.0000/0.00
    execution time (avg/stddev):   9.9927/0.00
UnixBench
UnixBench ist auch bekannt als BYTE UNIX Benchmark Suite.
dnf -y install wget unzip gcc gcc-c++ make perl

wget https://github.com/kdlucas/byte-unixbench/archive/master.zip
unzip master.zip
cd byte-unixbench-master/UnixBench
make
Benchmarking ohne Grafik:
./Run
Siehe auch https://github.com/kdlucas/byte-unixbench
Built on 2025-10-27